
If you’ve ever lost hours to manually compiling client data, juggling between spreadsheets or dreading end-of-month reporting like I used to, you’re in the right place.
As a long-time freelancer, I know firsthand how overwhelming it can be to keep reporting consistent, insightful, and client-ready, especially when you're wearing all the hats.
In this guide, I’ll walk you through exactly how to streamline your reporting process using automation, from picking the right tools and integrating your data sources to customizing reports based on your business type and client needs.
We’ll cover how to design reports that are both beautiful and effective, how to scale your workflow without losing your personal touch, and the best practices that have helped me turn reporting from a chore into a strategic asset.
Let’s make reporting something that works for you and your client. Not the other way around.
Benefits of automating your client reports
1. Saves time and reduces manual workload
Before I started automating my client reports, I’d spend hours each week toggling between tools, copying data into spreadsheets, and formatting charts that clients barely glanced at. It was exhausting, and frankly not the best use of my time.
Automating my reports gave me back hours each week and let me focus on strategy instead of spreadsheets.
Once I integrated automation into my workflow, I reclaimed those hours. The shift let me focus on strategy and actual client results rather than drowning in data entry.
It’s wild how much more efficient things become when you stop doing repetitive tasks manually and let the tech do the heavy lifting.
2. Delivers consistent and professional data outputs
There was a time when every report I sent looked slightly different depending on how rushed I was or what data I had remembered to include.
That inconsistency didn’t just create confusion for clients - it made me look less polished than I wanted to be. Automating my reports changed that.
Now, every client receives well-designed, uniform reports that highlight the exact metrics they care about, every single time. Not only do they look more professional, but they also build trust by making my service feel dependable and buttoned-up.
3. Enhances scalability and accommodates more clients
As a freelancer, scaling used to feel impossible. I hit a ceiling not because of lack of demand, but because I physically couldn’t produce quality work and reports for more than a few clients at once.
Taking on more clients didn’t mean more stress, just repeating a system that scaled with me.
That bottleneck disappeared when I started automating reporting. With the right setup, onboarding new clients didn’t mean doubling my workload. It meant duplicating a system I had already perfected.
Automation made it feasible for me to grow without burning out, which ultimately helped me transition from surviving to thriving.
4. Provides faster, real-time insights
Clients today expect answers fast, and waiting until the end of the month to analyze performance just doesn’t cut it anymore.
Automation let me offer real-time insights through dashboards and live links. Instead of spending hours each week pulling updated numbers, my clients can now log in and see their latest stats anytime they want.
That level of transparency not only makes them feel more in control, it also makes me a more valuable partner. More than just reports, I’m delivering insight when it matters most.
Setting up automated reporting: a step-by-step guide
Step 1: Identify reporting objectives
When I started out, I’d pack every metric I could find into my reports, thinking more was better. Clients? They just got overwhelmed.
What changed the game for me was asking upfront: “What does success mean to you?” Once I knew their real goals, whether it was leads, traffic, or engagement, I could zero in on the KPIs that actually mattered. It made my reports clearer, more relevant, and way more impactful.
Step 2: Choose the right reporting tool
1. Microsoft Excel
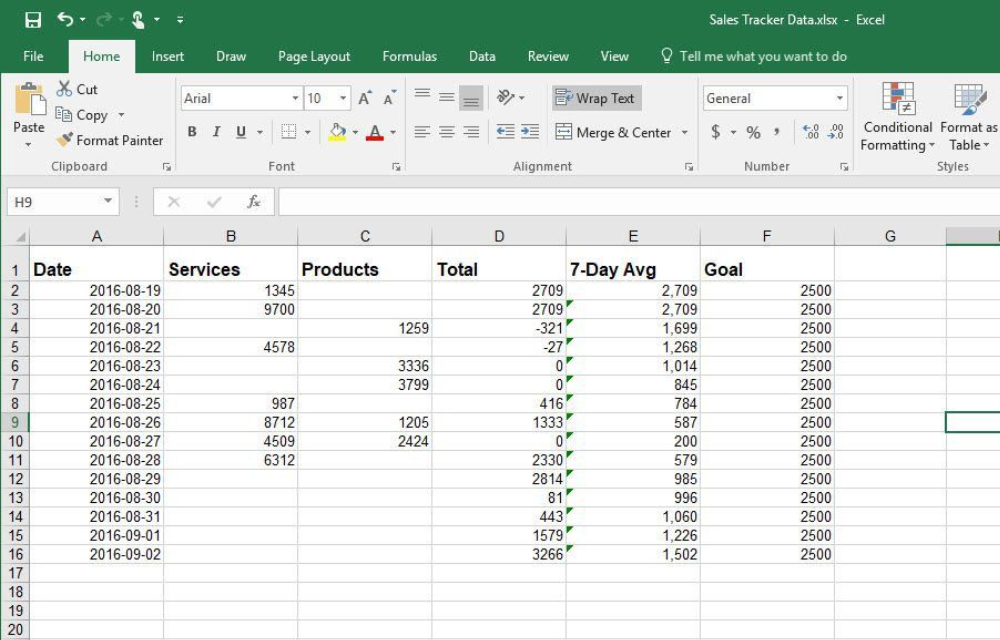
When I first started building client reports, Excel within M365 was my lifeline.
It might seem basic at first glance, but once I tapped into its real-time cloud syncing and integration with other Microsoft tools, I realized it could be a reliable data hub for everything else.
I use Excel to store structured campaign data, client KPIs, and custom inputs like survey results or lead scoring. Then, I link it directly to Power BI for visual dashboards. Because it’s online, I don’t need to worry about outdated versions or broken formulas.
I also love how flexible it is for handling both raw data and calculated metrics. If you're working solo or with a small team, using Excel as your backend makes it easy to control, update, and organize data without overcomplicating your setup.
Standout Features: Dynamic tables, cloud-based access, native M365 integrations
Pricing Plans: Included in most M365 Business Basic and Standard plans
Best For: Freelancers and solopreneurs who want a familiar yet powerful place to centralize client data
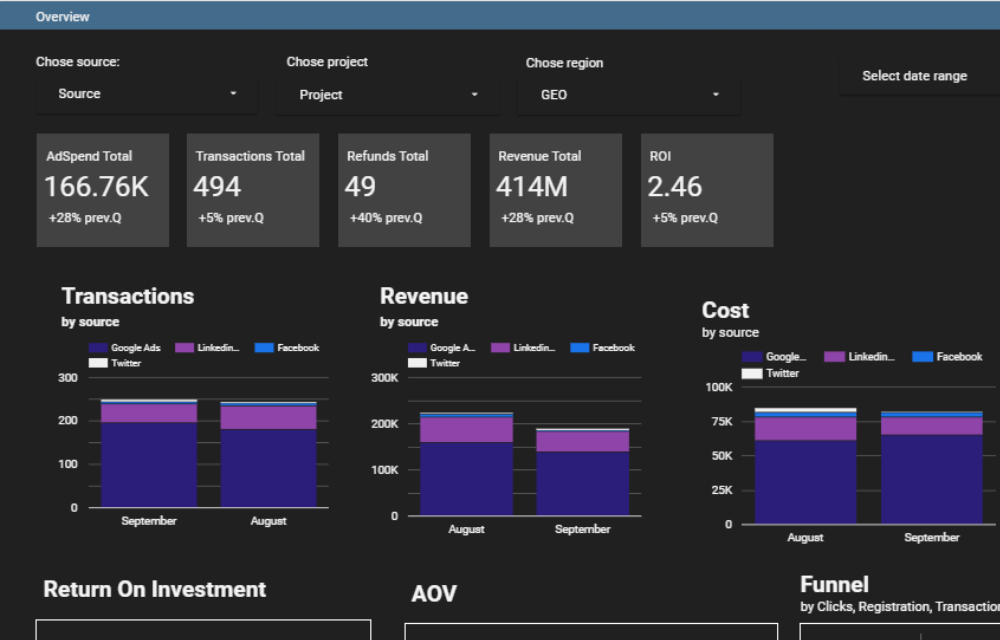
2. Power BI
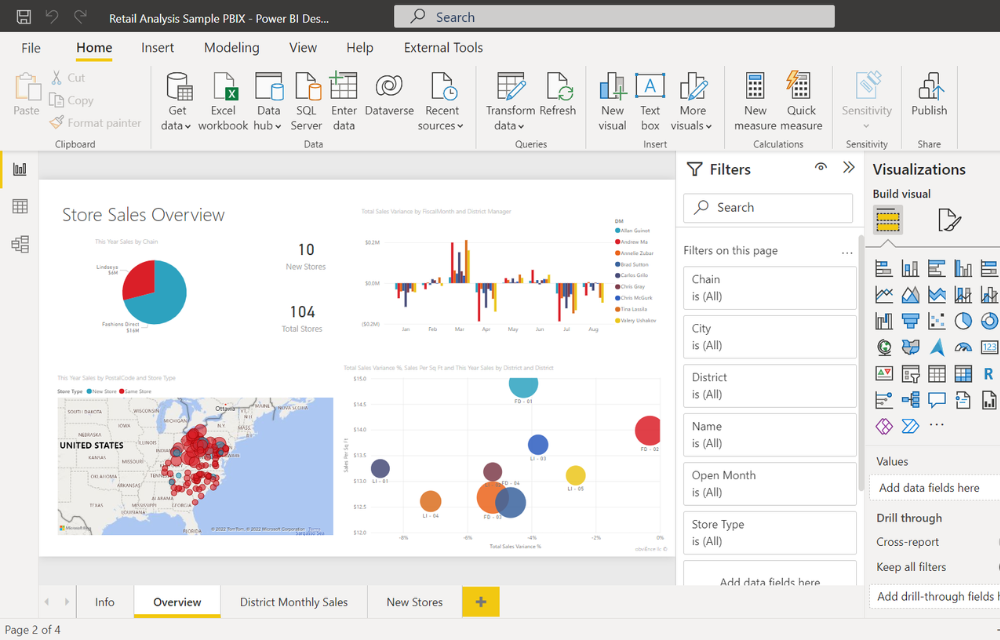
Power BI was a total game-changer for me once I started getting serious about data visualization. Built into the M365 suite, it gives you the power to transform rows of data from Excel into interactive dashboards that actually make sense to clients.
At first, I was intimidated. It looked VERY technical. But after a few projects, I realized it was just a drag-and-drop environment with a lot of control.
I use it to create branded reports that update automatically, so clients can view performance in real time without waiting on my emails. The beauty is how easily it links to Excel files stored in OneDrive or SharePoint, so I never need to re-upload anything.
Whether I’m tracking ad spend, lead generation, or content engagement, Power BI helps me tell the story behind the numbers.
Standout Features: Live dashboards, intuitive visuals, seamless Excel integration
Pricing Plans: Free tier available; Pro features included in M365 Business Standard or sold separately
Best For: Agencies and data-driven freelancers ready to elevate their reporting visuals
3. Power Automate
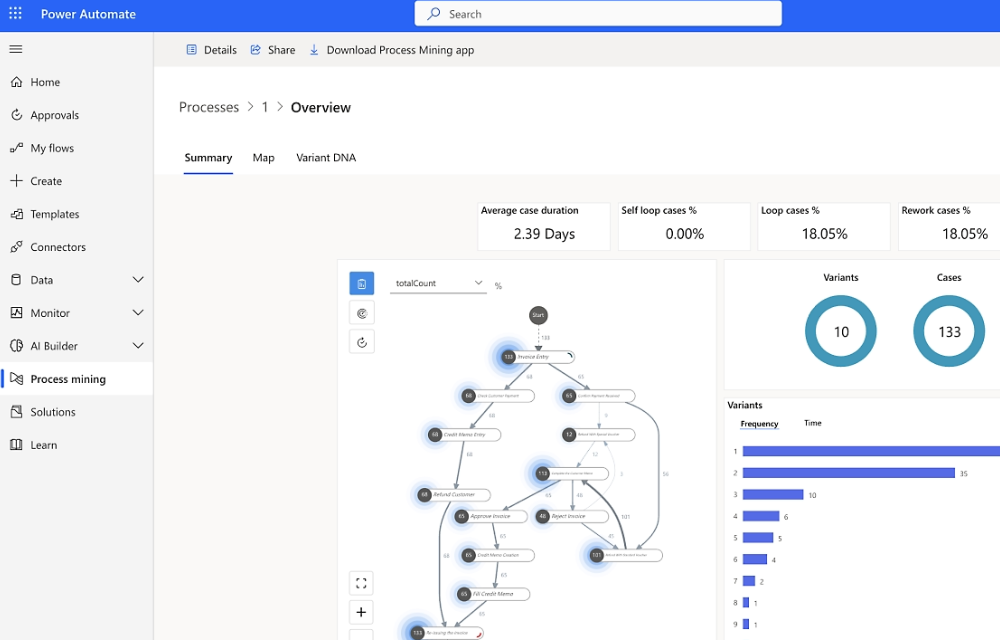
Power Automate might be the unsung hero of M365, but once I figured out how to use it with Power BI, it completely removed the manual parts of reporting from my workflow.
It’s essentially a workflow builder that connects your tools and actions. Think of it as the glue that automates your reporting system.
I use it to schedule Power BI data refreshes, send out email alerts when new reports are ready, and even move files between folders. It works quietly in the background, but it makes a huge impact on efficiency.
When I onboard a new client, setting up an automated report delivery flow through Power Automate is one of the first things I do. That way, updates go out on time like clockwork, without me having to lift a finger.
Standout Features: Prebuilt flows, customizable triggers, native Power BI automation
Pricing Plans: Included in M365 Business Standard; advanced features available with premium plans
Best For: Freelancers and small agencies looking to automate repetitive tasks and streamline report distribution
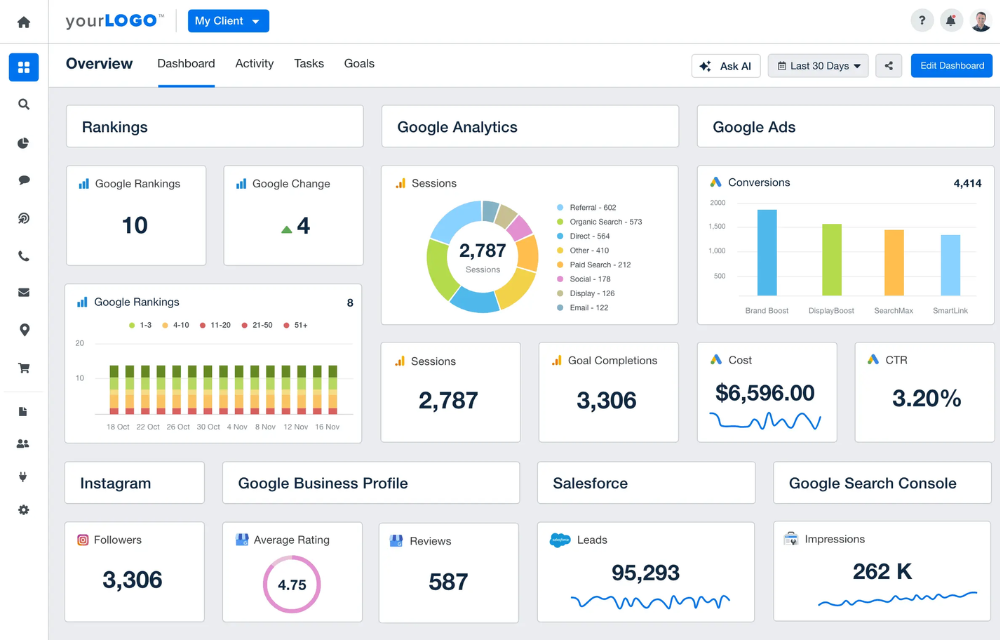
4. AgencyAnalytics
When I first started automating reports, I needed something that didn't make me feel like I needed a computer science degree to get it running.
AgencyAnalytics was one of the first platforms I tried that struck the perfect balance between user-friendliness and power. It integrates smoothly with tools I already use, such as Google Analytics, social media platforms, even eCommerce dashboards, and the prebuilt templates save a ton of time.
What I appreciate most is how easy it is to customize reports for each client without duplicating the effort. It’s scalable too, so I didn't need to jump platforms once I went from juggling three clients to over a dozen.
The interface is clean, the automation works like a charm, and the learning curve is refreshingly short. If you want a platform that makes you look polished without eating up your entire weekend, this one's a winner.
Standout Features: White-label reporting, drag-and-drop builder, prebuilt report templates, extensive integrations
Pricing Plans: Starts around $12/client/month depending on your agency size
Best For: Freelancers and small-to-midsize agencies looking for a low-maintenance, highly functional platform
5. DashThis
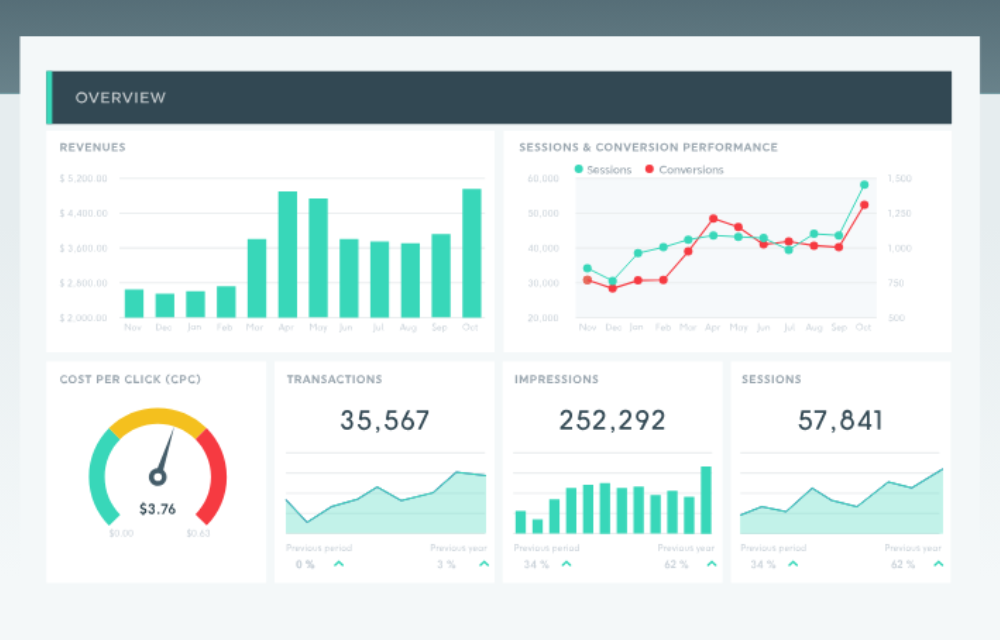
DashThis is what I reached for when I wanted my reports to look like I had a design team behind me, even though it was just me and a strong cup of coffee.
The interface is sleek and very visual, which makes client data feel digestible and easy to act on. I’ve found it especially helpful for social media-heavy campaigns or when clients want quick, visual insights instead of spreadsheets and jargon.
It's not as feature-rich as some other tools, but what it does, it does exceptionally well. Set-up is incredibly fast, and creating a new dashboard takes maybe five minutes, tops.
While it may not offer the deepest analytics for power users, it gets the job done beautifully for anyone who needs stylish, automated reports that impress without the fuss.
Standout Features: Visually polished dashboards, pre-set templates, fast setup, shareable links
Pricing Plans: Starts at $33/month for 3 dashboards
Best For: Solopreneurs and freelancers who want easy, elegant reporting with minimal setup
6. Looker Studio
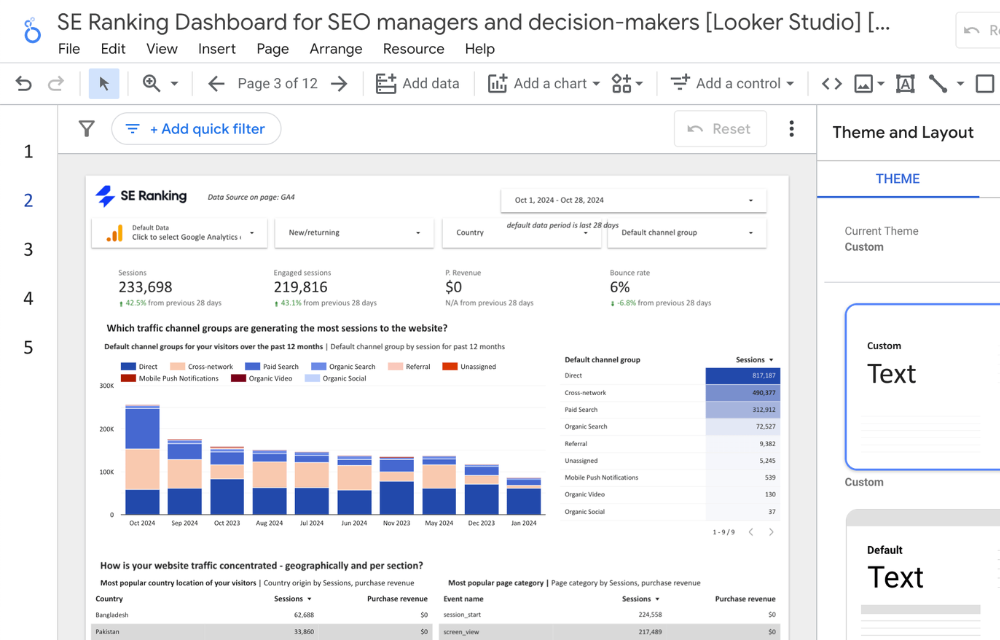
Looker Studio (formerly Google Data Studio) was a bit intimidating at first, but once I figured out how it works, it became my go-to for clients who need highly custom reporting.
It’s completely free, which was a lifesaver in my early days, and because it’s part of the Google ecosystem, it connects seamlessly with platforms like Google Analytics, Search Console, and Ads.
The real beauty of Looker Studio is its flexibility: I can build detailed, branded dashboards that feel tailored to each client without paying extra.
That said, there’s a learning curve, and it definitely takes more time to set up than plug-and-play tools. Still, if you're comfortable experimenting and want full creative control, this tool gives you the freedom to build whatever you need.
Standout Features: Full customization, unlimited dashboards, seamless Google integrations, 100% free
Pricing Plans: Free
Best For: Budget-conscious freelancers or agencies that need deep customization and full creative control
7. Whatagraph
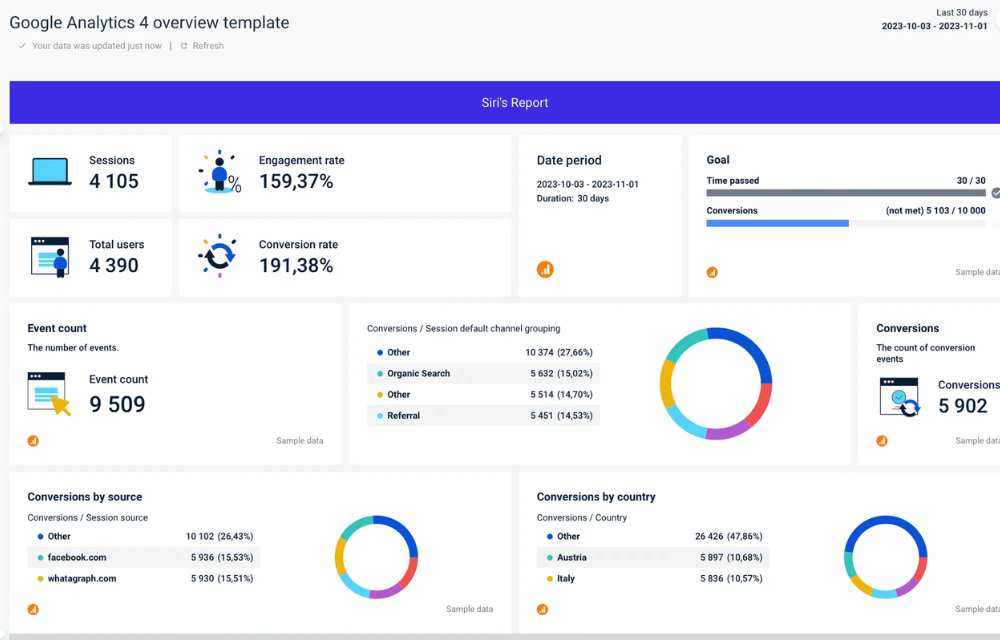
There was a point where juggling different platforms just to pull together one decent client report nearly broke me. Then I found Whatagraph, and it genuinely felt like the reporting gods threw me a bone.
What makes it stand out is how seamlessly it pulls data from various sources -Google Analytics, Facebook, HubSpot, you name it - and turns it into visual, client-ready reports that actually make sense.
I didn’t have to waste hours formatting or triple-checking numbers across platforms. Plus, I love that I can automate delivery so reports show up in a client’s inbox like clockwork, with minimal effort from me.
It’s intuitive, quick to set up, and makes me look 10x more organized and put-together.
Standout Features: Cross-channel data integrations, real-time visual reporting, automated delivery
Pricing Plans: Starts around $199/month for small teams
Best For: Freelancers and boutique agencies managing clients across multiple marketing channels
8. Improvado
I’ll be honest, Improvado wasn’t on my radar at first. It seemed more like a tool built for big agencies. But after struggling with spreadsheets and piecing together data from too many sources, I gave it a shot, and it delivered.
What hooked me was the data centralization. Instead of wasting energy on cleaning and syncing raw numbers, I could just focus on building smart, strategic reports. It’s not the cheapest option out there, but the time it saves and the depth of data access make it worthwhile if you're scaling.
Once I had a few higher-budget clients, investing in a tool like this made sense.
Standout Features: Enterprise-level integrations, customizable pipelines, powerful data visualization
Pricing Plans: Custom pricing based on needs, typically suited for larger budgets
Best For: Growing agencies or solopreneurs with complex, multi-platform reporting needs
9. Vendasta
I stumbled across Vendasta when I was searching for a more client-facing solution - something that could serve as a hub, not just a report generator. What really impressed me was how it combines reporting with client communication, task management, and even white-label options.
For a while, I was using three or four different tools to handle all of that. Now, with Vendasta, I can manage reports, update clients, and even upsell services without leaving the platform.
If you're offering bundled services or managing recurring deliverables, Vendasta feels like a digital assistant who never sleeps.
Standout Features: White-labeled client portals, automated insights, built-in sales tools
Pricing Plans: Starts at $99/month with scalable features
Best For: Solopreneurs and agencies offering a mix of marketing services looking to streamline client communication
Step 3: Connect your data sources
I used to waste hours copying numbers from different platforms into spreadsheets, trying to make sense of disconnected data. It was not only a massive time suck, but it left too much room for human error.
When I finally started integrating my tools - analytics, ad platforms, CRMs - into one reporting system, it felt like breathing room. Most platforms make this easy with one-click connections, but here’s the catch: garbage in, garbage out.
I now take time upfront to map the correct metrics, label my data sources clearly, and audit them regularly. If your connections are sloppy, your reports will be too. And clients notice.
Clean, reliable data flow starts with being intentional about your setup. It might take an extra 20 minutes, but it saves countless headaches later.
Step 4: Design and customize your reports
Once the data was flowing smoothly, I realized that presentation mattered just as much. Back in the day, I sent clients bland spreadsheets that looked like they came from the stone age.
These days, I build reports that are not just functional but easy on the eyes. Customizing colors, logos, and even how the graphs are displayed makes a huge difference.
I try to strike a balance between visual simplicity and depth. Bar charts for trends, summaries for context, and clean formatting throughout.
The goal? A client opens the report, gets the story fast, and doesn’t need a second call to understand what happened. It’s not about showing off design skills; it’s about clarity and polish that builds trust.
Step 5: Schedule and automate delivery
Manually sending reports used to be one of those tasks I constantly pushed to “later.” Until I forgot.
Automating delivery changed everything for me. Now, I set up delivery rules once - weekly or monthly depending on the client - and let the tool do its thing. Some clients like reports in their inbox, while others prefer a live dashboard link they can check whenever they want. I offer both.
What’s cool is that most platforms let you personalize the messages too, so the email doesn’t feel robotic.
The end result? My clients get consistent updates, and I don’t stress about remembering to hit send. It’s a win on both sides.
Customizing reports based on business type
1. Freelancers and solopreneurs
When I was flying solo, budget and time were the two things I never had enough of. I needed a reporting solution that wouldn’t break the bank but still helped me look professional.
The good news? There are plenty of lean tools out there with just the right mix of automation and customization.
I started small, using simple dashboards and templates, but I always made sure to personalize the insights. Dropping in a short note that connects the data to the client’s goals goes a long way. It builds trust and makes your work consultative.
Managing multiple clients this way felt manageable because I had systems in place. Reports basically ran on autopilot while I focused on doing the actual client work. That’s what helped me grow without burning out.
2. Agencies and small businesses
Once I started collaborating with a team, I quickly realized that scaling wasn’t just about doing more. It was about doing it smarter.
What made a difference was choosing tools that let us assign roles, reuse branded templates, and automate recurring tasks across client accounts. Instead of one person owning the whole reporting process, we now divide responsibilities and set approval flows that keep quality consistent.
When you're juggling dozens of clients, the ability to duplicate and tweak reports in minutes becomes a huge time-saver. It took trial and error, but now our workflow is dialed in.
Clients get polished, relevant reports on time, and our team isn’t scrambling behind the scenes. That kind of operational efficiency keeps everyone happier.
Best practices for effective client reporting
1. Keep reports concise, actionable, and tailored
I used to believe longer reports made me look more professional, but honestly, they just made my clients tune out.
Now, I treat every report like a curated story: tight, relevant, and packed with only the insights that actually help the client make a decision.
The trick is to highlight what changed, why it matters, and what to do next. Whether it’s two pages or ten, it needs to answer their unspoken question: “So what?” If a report can’t do that clearly and quickly, it’s just background noise.
2. Periodically update templates and metrics based on evolving client goals
There was a time I’d send the same template to clients month after month without a second thought.
What mattered last quarter might be irrelevant today.
Eventually, a client asked, “Why are we still tracking this?” That was a wake-up call. I started revisiting my templates regularly, making sure what I was reporting aligned with their current objectives.
A launch phase has different KPIs than a scale-up phase. Just because a metric mattered last quarter doesn’t mean it’s still relevant. Now, every reporting cycle starts with one question to myself: Is this still helping them move forward?
3. Maintain transparency and clarity, and avoid jargon
At one point, I thought using industry terms made me sound like I knew my stuff. But I kept getting the same blank stares and follow-up emails asking what half the report meant.
So I flipped the script. I started writing reports like I was explaining them to a smart friend outside the industry. And you know what?
Clients started engaging more, asking better questions, and actually looking forward to our check-ins. It’s about making your value easy to understand.
4. Always include human insights on top of automated data
Automation’s great for speed, but clients don’t pay you just to copy-paste graphs. They want context, recommendations, and your interpretation.
I used to send auto-generated dashboards with no commentary, assuming the numbers spoke for themselves. But without my input, they didn’t really tell a story.
Now, I treat the data as the foundation and layer on my perspective. A few lines on what went well, what needs tweaking, and what’s next turns a static report into a strategic tool. That’s where your expertise truly shines.
Make reporting your superpower, not your stressor
After years of wrestling with scattered spreadsheets and last-minute reporting chaos, moving to an automated reporting system was the shift I didn’t know I needed.
It wasn’t just about saving time. It helped me deliver clearer insights, stay organized, and focus more on the work that actually matters to clients. When reports update themselves and get delivered automatically, your client communication becomes smoother, and your workflow feels more manageable.
Tools like Excel, Power BI, and Power Automate worked together to create a system I could build once and reuse again and again. If you're in that stage where you're trying to grow, keep clients happy, and reduce the overwhelm, getting started with M365 Business is a smart step.
If you're looking for a more streamlined, repeatable way to handle reporting, try setting up an M365 Business plan through GoDaddy.
It’s a small shift that can completely change the way you work.