
Momentum Breaks Records: 2025 GoDaddy Microbusiness Activity Index Annual Report
Research overview
Momentum Breaks Records: 2025 GoDaddy Microbusiness Activity Index Annual Report
New insights reveal how small digital businesses are reshaping the U.S. economy, driving job creation, and narrowing ecosystem divides.
Overview
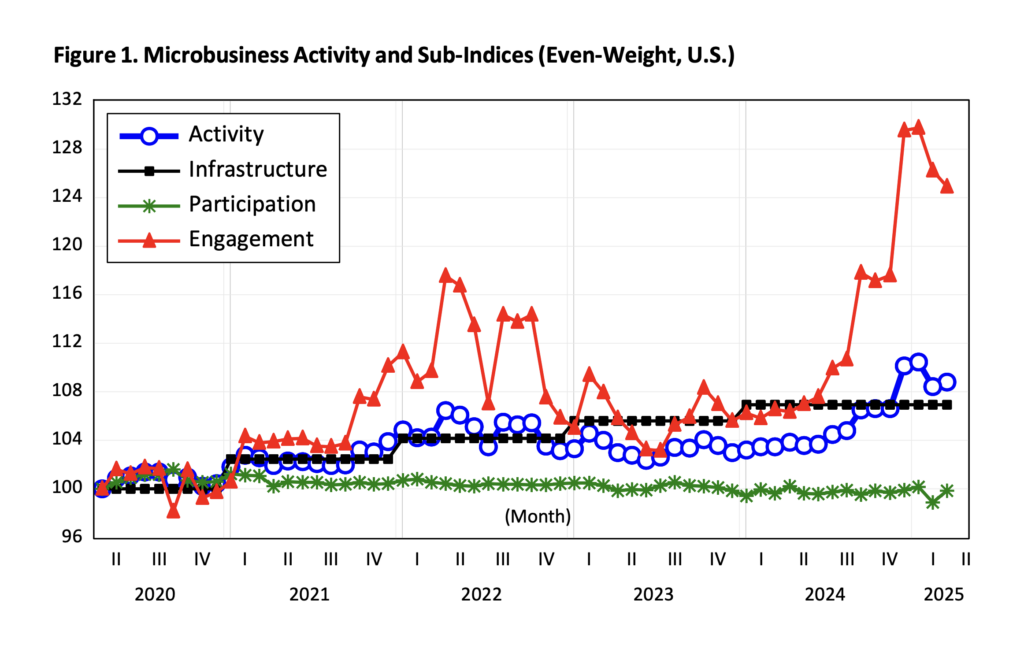
The GoDaddy and UCLA Anderson Forecast Microbusiness Activity Index (MAI) tracks the health and impact of small and microbusinesses – businesses with fewer than 10 employees that have a GoDaddy domain and an active website. It is comprised of 3 sub-indeces: Infrastructure (internet availability and human capital), Participation (number of people and microbusinesses), and Engagement (the maturity of websites in features, traffic experienced, backlinks, etc.). The 2025 MAI report reveals that microbusiness website activity has reached record-breaking levels among other new findings.
Record Growth
Microbusiness momentum has surged to unprecedented levels, with the MAI’s Engagement sub-index jumping sharply from 106.6 to 124.9, marking its largest-ever annual increase. This jump is driven primarily by widespread adoption of generative AI tools such as GoDaddy’s Airo, ChatGPT, and Claude. These technologies enable online entrepreneurs to significantly boost productivity, features, content and customer interactions, empowering them to achieve more with limited resources. Further analysis:
- Infrastructure is steadily improving nationwide, providing vital support for digital entrepreneurs with fewer variance in scores across cities than just a few years ago.
- Participation remains stable, reflecting consistent entrepreneurial activity relative to population growth.
Entrepreneurs Fuel Jobs and Income Gains
Microbusinesses don’t just support individuals, they actively boost local economies and job markets. According to the latest MAI data:
- Each new microbusiness owner generates approximately eight additional jobs, showcasing their outsized impact by hiring directly or creating greater demand locally
- A one percentage-point increase in microbusiness density corresponds with a 6% rise in local household income at the county-level
- Each 1% increase in microbusiness entrepreneurial activity also corresponds to a 2% gain in HH income.
Emerging Metros Narrowing the Gap
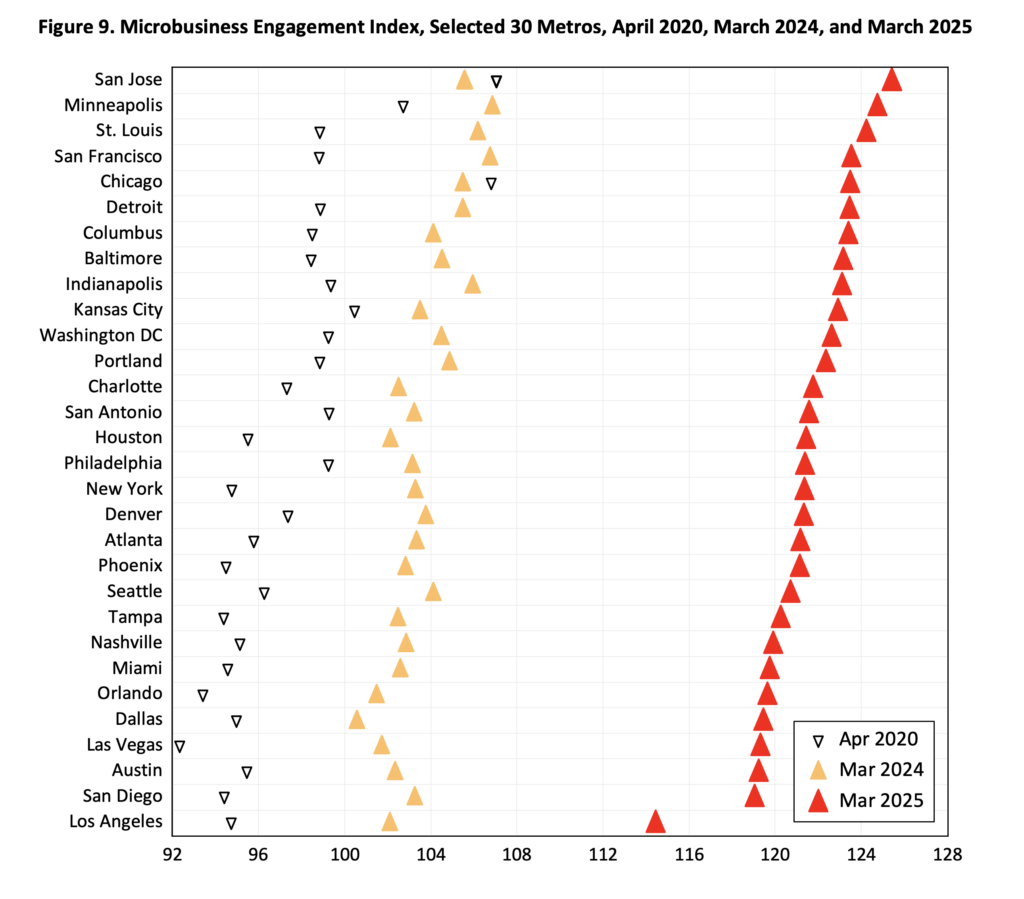
Traditional tech-focused metros like San Jose, San Francisco, and Washington, D.C. remain dominant in overall MAI scores. However, the gap between these leaders and previously lagging metros is narrowing. Cities such as Dallas, Charlotte, and Kansas City have demonstrated some of the largest annual improvements, driven by significant advances in digital infrastructure and local entrepreneurial support systems.
Meanwhile, Miami, Los Angeles, and San Jose lead the Participation Index, meaning that the number of new entrepreneurs and businesses is exceeding typical population growth in these diverse and digitally connected cities.
Closing the Infrastructure Gap
The convergence of scores between top-tier and bottom-tier cities isn’t driven by changes in participation but rather by improvements in infrastructure. Investments in digital resources, internet access, and support networks are likely enabling previously underserved metros to foster local entrepreneurship, significantly narrowing economic divides.
Why the MAI Matters
Small and microbusinesses remain a cornerstone of economic resilience and growth across the U.S. economy. Their activity generates jobs, increases local household incomes, and reduces unemployment, providing essential economic stability nationwide.
Explore the Full 2025 MAI Report
To delve deeper into these insights and explore detailed analysis, download the full GoDaddy Microbusiness Activity Index (MAI) Report for 2025.
More Stories & Use Cases

Ambitious, Scrappy and Optimistic: A Look at Under-30 Microbusiness Owners
Many Americans responded to the economic turbulence of recent years by starting microbusinesses. While all of these everyday entrepreneurs need to be scrappy, ambitious and optimistic, one demographic group stands out for these qualities: those under the age of 30.
Read the article entitled “Ambitious, Scrappy and Optimistic: A Look at Under-30 Microbusiness Owners”
2022 National Survey Results
GoDaddy’s in-depth annual survey of online entrepreneurs shows increasing diversity by gender, race, and economic circumstance. Here’s what they had to say.
Read the article entitled “2022 National Survey Results”
Tackling the Awareness Gap Between Small Businesses and City Hall
Government programs can be effective, but only if entrepreneurs know about them. Hundreds of cities across the country offer programs […]
Read the article entitled “Tackling the Awareness Gap Between Small Businesses and City Hall”