I recently wrote about some of the Jenkins CICD best practices we use on my team at GoDaddy. One of the best practices was:
You should use declarative pipeline.
Most of our pipelines provide per-stage status checks shown on the GitHub PR page. For example:
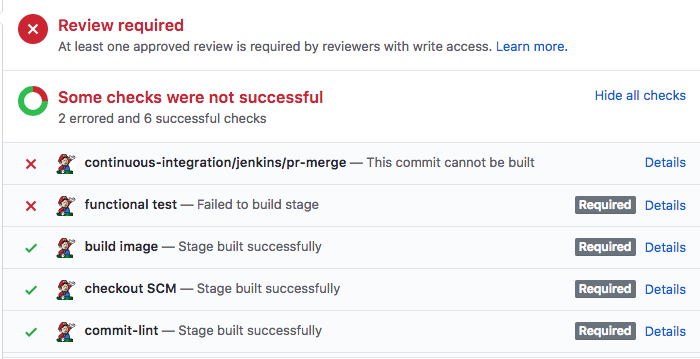
Our engineers like this because they don’t have to leave GitHub so see whether the PR built successfully.
We used a shared Groovy library that provides support for sending a “Pending” status when a stage begins, and “Success” or “Error” when the stage completes. While converting our first jobs to declarative pipeline, we encountered a common script pattern for this which proved to be difficult to convert to declarative pipeline cleanly.
For example:
import org.godaddy.CommitStatus;

gdnode {
  def lintTestStatus = new CommitStatus(
    [description: 'Running linters',
     context: 'Linters',
     credentialsId: 'xxxxxxxxxx',
     workflow: this]);
  def unitTestStatus = new CommitStatus(
    [description: 'Running unit tests',
     context: 'Unit tests',
     credentialsId: 'xxxxxxxxxx',
     workflow: this]);
  def integrationTestStatus = new CommitStatus(
    [description: 'Running integration tests',
     context: 'Integration tests',
     credentialsId: 'xxxxxxxxxx',
     workflow: this]);
  def functionalTestStatus = new CommitStatus(
    [description: 'Running functional tests',
     context: 'Functional tests',
     credentialsId: 'xxxxxxxxxx',
     workflow: this]);

  CommitStatus.with([lintTestStatus, unitTestStatus, integrationTestStatus, functionalTestStatus]) {
    pipeline(
      [lintTest: lintTestStatus,
       unitTest: unitTestStatus,
       integrationTest: integrationTestStatus,
       functionalTest: functionalTestStatus])
  }
}
...
void pipeline(statuses) {
  def dockerTag = env.DOCKER_BUILD_TAG;
  def shortSha = env.GIT_SHORT_COMMIT;

...

  stage('npm run eslint') {
    sh 'docker run --rm ' +
      '-e APP_GROUP_ID=$(id -g) ' +
      '-e APP_USER_ID=$(id -u) ' +
      "${dockerTag} npm run eslint"
  }
  statuses.lintTest.set('success');

  stage('npm test') {
    sh 'docker run --rm -v $(pwd)/results:/app/results ' +
      '-e APP_GROUP_ID=$(id -g) ' +
      '-e APP_USER_ID=$(id -u) ' +
      "${dockerTag} gosu alone npm test -- -R xunit --reporter-options output=results/unit.xml"
      step([$class: 'JUnitResultArchiver', testResults: 'results/unit.xml'])
  }
  statuses.unitTest.set('success');
We could have used inline script (provided for backward compatibility with traditional
scripted pipeline), but we would have missed a lot of the benefit of switching to
declarative pipeline script.
A new plugin is born
There are already a few Jenkins plugins which can report GitHub status, but the ones we found rely on the pipeline self-reporting status information, similar to our groovy library. These plugins still require adding at least two lines of groovy in the Jenkinsfile to work the way we wanted - one to mark the check as Pending when a stage starts, and another to mark it as Succeeded or Failed when the stage ends.
We decided we could simplify our pipelines even more (and eliminate possible bugs) by writing a plugin which didn’t require any groovy in the Jenkinsfile to report status. The GraphListener extension point, which a plugin can implement to be called whenever any stage or step starts or ends seemed like it could be used for monitoring, and indeed we were able to use it to write the first version of the GitHub Autostatus plugin, which provided Pending and Success or Error notifications as stages were started and stopped. Since we were only trying to solve the immediate problem of declarative pipelines, this version only supported declarative pipeline. This was a nice simplification, since declarative pipelines offer a data model that lets a plugin enumerate all the stages in a pipeline; this takes a little more work for classic scripted pipeline.
A new problem
One of our main pipelines builds Web, Android, and iOS applications from a common javascript code base, using React for the web and React Native for mobile. We went through a period recently where the build failed so often that our engineers could barely merge any changes. The problem was we didn’t have enough data to know which part(s) of the pipeline failed the most often, so it was hard to prioritize where to focus the most effort.
That’s when we realized that the GitHub autostatus plugin was very close to solving the problem. It already provided per-stage information, so all it needed to do was provide that same information to a second source, and we’d have dashboards for our builds.
We decided to initially use Grafana for the dashboards, using InfluxDB as the database. Although there were a variety of options available, we chose this configuration for the following reasons:
- It has a very simple REST API which can be called easily from Jenkins
- It’s relatively easy to set up instances, including locally which is helpful for development
- Grafana has some nice templating features which allow you to use a query to build multiple similar copies of a graph. For example, instead of building graphs for each GitHub repo being monitored, you can build a set of graphs for one repo as a template, then use a query as a template to copy that set for some or all repos you have data on.
- You can host sample dashboards on grafana.com, making it easier for people to use the plugin
There are other good options, and it’s likely the plugin will be extended to support others in the future.
In the rest of this article, I’ll talk about the high-level design of the plugin, then provide some pointers for configuring it.
High-level design
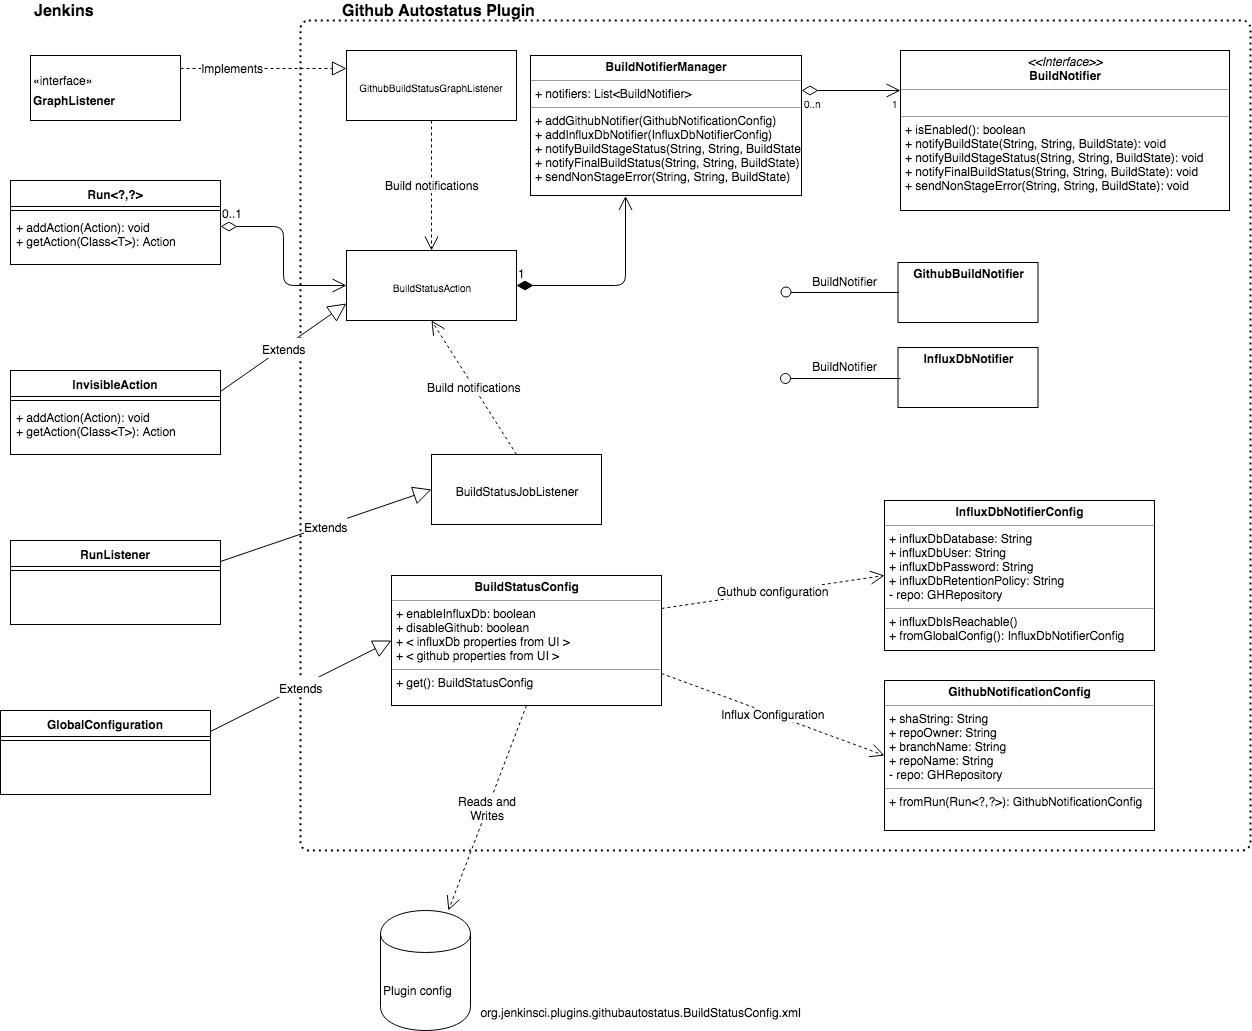
The following class diagram shows the architecture of the plugin.
Job watching components
GitHubBuildStatusGraphListener
The GitHubBuildStatusGraphListener class is responsible for:
- Creating a BuildStatusAction and attaching it to the build. This class is responsible for sending the actual notifications
- Determining when stages start and end
- Sending pending notifications for each stage via the BuildStatusAction instance attached to the build
- Sending success or error notifications with timing via the BuildStatusAction instance attached to the build when a stage completed
It receives notifications via the GraphListener interface. Plugins which correctly implement the interface get called via the interface’s onNewHead(flowNode) method for each FlowNode. FlowNodes represent the start and end of blocks and atom nodes (individual steps which can’t be broken down further).
Flow node example
One of the easiest ways to visualize the calls made to the GraphListener extension is by examining Jenkins’ Pipeline Steps build action, which is available from the build page for every pipeline build.
This build action provides UI which lists all BlockStartNode and AtomStepNode flow nodes (but not BlockEndNode); each line on that page should have a corresponding call to the plugin’s GraphListener.onNewHead().
Consider the following declarative pipeline script:
pipeline {
  agent any
  stages {
    stage ('stage 1') {
      steps {
        sh 'echo stage 1 step 1'
      }
    }
    stage ('stage 2') {
      steps {
        sh 'echo stage 2 step 1'
      }
    }
  }
}
The Pipeline Steps build action links to this page:
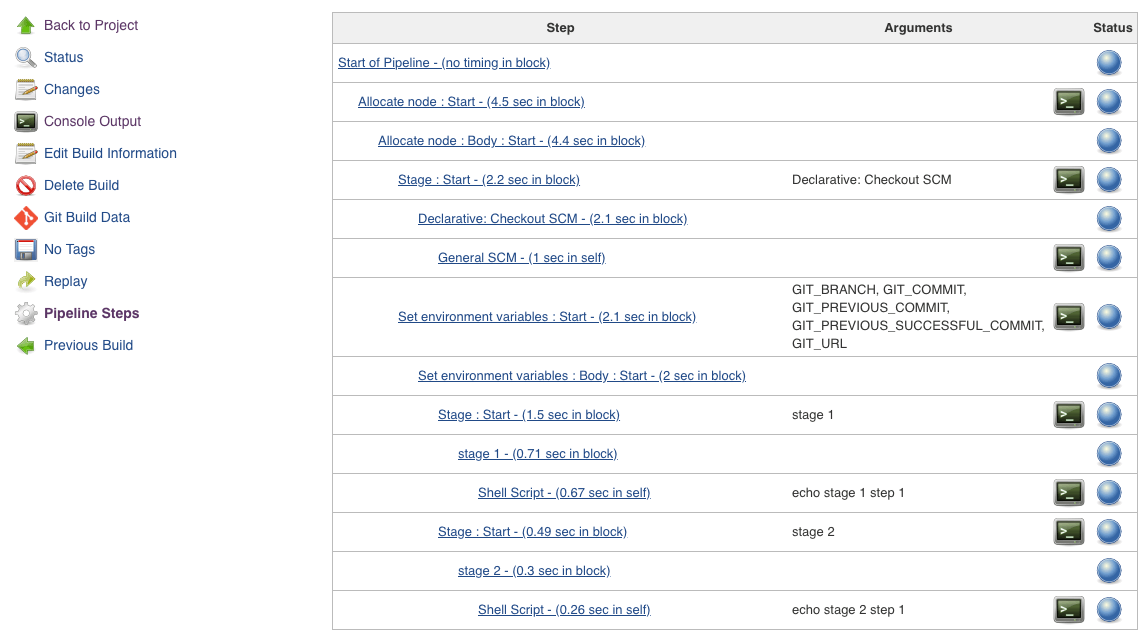
You can see representations for every stage and step in the plugin, plus additional stuff added by Jenkins automatically.
onNewHead(flowNode) is called with the following flowNodes.
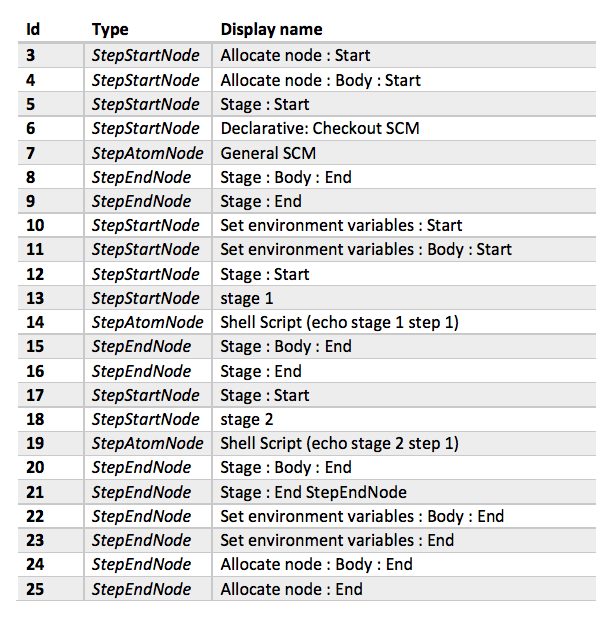
StepStartNode Flow nodes contain additional properties to help identify their purpose, but that’s enough detail for this example.
onNewHead(flowNode)’s (simplified) algorithm is:
- Get or create a BuildStatusAction (See [1] below)
- Add a new stage to the BuildStatusAction for non-declarative jobs
- Check any StepAtomNodes for an out of stage error (See [2] below)
- If a StepEndNode’s display name matches any stage, send stage status notification to all notifiers via the BuildStatusAction.
Notes
- If the code is processing a declarative pipeline job, it creates information for each stage and sends Pending notifications at the same time it creates the BuildStatusAction. It can do this because the Declarative Pipeline plugin provides a model that enumerates the stages. Since classic pipeline doesn’t do that, each stage is discovered when it starts; the code handles both cases.
- Out of stage error only applies to classic pipeline. Since the structure is very loose, it’s possible to code a step that is outside of a stage. Without special processing to detect that scenario, errors in that step would be missed.
BuildStatusJobListener
The BuildStatusJobListener class is responsible for sending job notifications when the build completes. Overall job notification includes build time and success or error status.
Job notification components
All notifications are sent through the BuildStatusAction class. Build action is Jenkins extension mechanism which allows a plugin to attach information to a build. Originally intended to provide links (called build actions) on the build page, it’s become a general purposed mechanism that allows any plugin to associate information with a build - potentially permanently, as they get serialized along with the build by default.
The BuildStatusAction class keeps a list of all stages, so it can keep track of whether the final notification has been sent. It also keeps a list of notifiers, and provides an interface that can be called to send notifications to all notifiers.
GitHubBuildNotifier
This class is responsible for sending per-stage status information to GitHub if it’s configured to do so in the plugin settings. It uses the GHRepository API.
InfluxDbNotifer
This class is responsible for sending per-stage and job status information to a InfluxDB instance if it’s configured to do so, using the InfluxDB REST API.
Configuration components
BuildStatusConfig
BuildStatusConfig extends the GlobalConfiguration class, which allows it to provide UI in the Jenkins system configuration page to configure the plugin.
GitHubNotificationConfig and InfluxDbNotifierConfig
Each type of notifier has matching configuration components which are responsible for examining the global configuration to determine whether the notifier should be enabled for the current build. Abstracting configuration away to separate classes provides good separation of concerns; determining whether to provide GitHub status in particular requires quite a bit logic. It also simplifies a lot of the unit tests, since dependency injection can be used to provide fake configurations without setting up a full build.
Reporting with InfluxDB and Grafana
InfluxDB is a time series database that is available for free to run on a single node (there’s also a paid Enterprise version). Grafana is an analytics platform which allows you to build dashboards from time series databases, including InfluxDB. It also has a free version which can be used for Jenkins monitoring.
Time series databases are databases which are based on time stamped events. They are widely used for monitoring, because they allow you to aggregate events based on different time ranges. Although there are many good choices, we chose InfluxDB for the initial monitoring implementation for the autostatus monitoring plugin.
InfluxDB schema
In InfluxDB, data is written to series, which are analogous to tables in a relational database. Records in a series contain both tags and fields. Fields are generally meant to be measurements which are aggregated, while tags are meant to be metadata. As such, tags are indexed and can be queried efficiently, while fields are not. Grafana does a good job of only allowing you to use the correct type while building dashboards, but this is discussed in more detail in the InfluxDB documentation.
The plugin writes two different series:
- the job series allows you to build dashboards that monitor timing and success rate for jobs
- the stage series provides success/failure information for each stage in every job, and allows you to build dashboards to monitor individual stages.
In both cases, we want to measure build time and success/failure, so those need to be fields; everything else can be tags so they are indexed.
Job Series Schema
| Name | Tag/Field | Description |
|---|---|---|
| owner | Tag | GitHub owner |
| repo | Tag | GitHub repo |
| branch | Tag | The name of the branch |
| jobname | Tag | The full job name |
| result | Tag | Queryable result |
| jobtime | Field Job elapsed time (ms) | |
| passed | Field | 1 = passed, 0 - failed |
Stage Series Schema
| Name | Tag/Field | Description |
|---|---|---|
| owner | Tag | GitHub owner |
| repo | Tag | GitHub repo |
| branch | Tag | The name of the branch |
| jobname | Tag | The full job name |
| result | Tag | Queryable result |
| stagename | Tag | Stage name |
| stagetime | Field | Stage elapsed time (ms) |
| passed | Field | 1 = passed, 0 - failed |
Note that pass/success is represented twice. The passed fields can be used for measurement, for example total failures, or average failures. The result tags are indexed and so can be queried efficiently, for example select only measurements where the job or staged failed. The result tag will have one of the following values:
- CompletedSuccess
- CompletedError
- SkippedFailure (stage only)
- SkippedUnstable (stage only)
- SkippedConditional (stage only)
Setting up dashboards
Install Grafana and InfluxDB
If you don’t already have Grafana and InfluxDB:
Configuring InfluxDB
InfluxDB doesn’t have a UI, but you can configure it from the command line. To open the InfluxDB console, type influx, which should open the InfluxDB console:
influx
Connected to http://localhost:8086 version v1.5.2
InfluxDB shell version: v1.5.3
>
Follow the following steps in the console:
- create a database
create database jekninsdb - (optional) create a user so you can use authentication
use jenkinsdbcreate user jenkins with password 'password'(password is a placeholder for the password you want to use)grant read on jenkinsdb to jenkinsgrant write on jenkinsdb to jenkins- follow the instructions in the authentication documentation for enabling authentication, as it is disabled by default
- (optional) create a retention policy to define how long data is kept - by default it is kept forever. The amount of data written by the plugin is small, so this might be OK if you want a lot of historical data. For example, to keep data for a year, and dispose of 4 weeks’ worth of data at a time:
create retention policy autostatus on jenkinsdb duration 52w replication 1 shard duration 4w
Note the retention policy is part of the namespace for querying; if you decide to add it later you will need to migrate your existing data to the new retention policy, so it’s worth creating a retention policy up front.
For additional configuration please consult - Configuring InfluxDB
Configuring Jenkins
In order to send data to your dashboard, you’ll need to install and configure the plugin in Jenkins.
Installing the plugin
The autostatus monitoring plugin is available via the Jenkins plugin manager. If it’s not installed you can install it as follow:
- Log in to Jenkins with an account with admin access
- Click the
Manage Jenkinslink at the top left - Click the
Go to plugin managerbutton or theManage Pluginslink to open the plugin manager - Click the
Availabletab and find theGitHub Autostatus Plugin. Note the plugin will be renamedAutostatus Build Monitoring Pluginin the near future. - Check the box next to it
- Click the
Install button - Jenkins may or may not restart, depending on pending installations
Please visit the plugin wiki page for instructions about configuring the plugin and downloading sample dashboards from grafana.com.
Future work
Some of the things planned for the future include:
- An Elastic Search notifier for building dashboards in Kibana
- Additional data, such as code overage information and test case pass/fail rate
- Exporting an extension point to build 3rd party notifiers. For example, some companies may already have a REST API for reporting; an extension point would allow them to write notifiers which send data to their REST API without needing to add support to the public plugin.
Further reading
- Comprehensive list of Jenkins extension points
- Autostatus monitoring plugin wiki page
- Autostatus monitoring GitHub page
- InfluxDB CLI
- InfluxDB Authentication
Note: cover photo courtesy of https://jenkins.io/

