

As a small business owner, you probably know how important it is to keep track of your key performance indicators (KPIs). But you might be struggling with how to track them and which tool should you use for that purpose. The good news is that you don't have to spend money on an expensive tool or learn new software. You likely already have a powerful tool at your disposal that you use on a daily basis. The tool in question is Excel and in this post, we'll show you how to use it for more than just keeping your finances in order.
Many small business owners use Excel to track their revenue through a simple balance sheet or a profit and loss statement. But, when you dig a little deeper, you'll see that Excel can be used for much more — including keeping track of your KPIs.
7 ways to use Excel to keep track of your KPIs
Here are seven ways you can use Excel to keep track of your key performance indicators:
-
Monitor your social metrics.
-
Keep a record of your email subscribers.
-
Keep track of ad performance.
-
Log sales per customer.
-
Monitor your conversion rate.
-
Evaluate your blog post performance.
-
Keep an eye on your site traffic.
Before we dig into the article, it’s worth mentioning that you need to decide on what your KPIs will be and what metrics you will track to see if you're meeting those numbers. Once you've decided on your KPIs, it's time to put Excel to work.
Related: Small business metrics that really matter
1. Monitor your social metrics
Let’s start off with something easy —use Excel to keep track of your social media follower growth or post engagement. You can do this by creating a single column that lists each social media profile you want to track and then adding columns for each month of the year. Then all you have to do is record the number of followers each month.
You can also add a chart that shows growth on each platform in a visual way.
Similarly, you can track the engagement your posts get on a regular basis. This can help you see which posts get more shares, comments and clicks so you know what type of content resonates better with your audience.
Related: Social media metrics and ROI — What your business needs to know
2. Keep a record of your email subscribers
Take advantage of Excel to create a spreadsheet that allows you to keep track of your email list growth. You can make a record of how many new subscribers you get on a monthly basis as well as which opt-in forms perform better.
If you want to get really granular, you can keep track of your open and click-through rate for individual campaigns or create a table that holds the best performing subject lines.
Related: Beginner’s guide to starting an email list
3. Keep track of ad performance
If you're using paid advertising to promote your services and products, then you know how important it is to keep track of ad performance. Not only will your ad performance results tell you which ad sets are bringing you more sales and leads, but monitoring those results also gives you an insight into your marketing spend so you can evaluate your return on investment.
To create a spreadsheet for this purpose, decide which metrics you'll monitor and then create columns for them.
You could have a column for the number of impressions each ad received, the clickthrough rate, keyword cost, ad relevance score, conversion rate and more. You could even automate populating the sheet by pulling in relevant information from your ad platform dashboard using a tool like Zapier.
Related: What’s the difference between Amazon advertising and paid ads on Google and Facebook
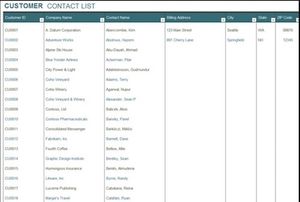
4. Log sales per customer
Keeping track of how many products or units you've sold is a great way to stay on top of your company profits. However, you also need to monitor how many sales per individual customers you made throughout the year.
Doing this allows you to see which customers are repeatedly coming back and making a purchase as well as how much they are spending. You can also use that information to calculate your average customer lifetime value.
5. Monitor your conversion rate
Another way to use Excel to track KPIs is to monitor your conversion rate. Depending on your business and how many sales and marketing channels you're using, you can monitor the conversion rate of:
- Your ads
- Your social media posts that promote your services, products or email opt-in
- Your blog posts
- Your landing and sales pages
- Your email campaigns
… and more
You'll need to create columns that make note of the total size of the audience that saw your promotion and the number of people who either made a purchase or signed up for a program or your email list.
Related: How to achieve double-digit eCommerce conversion rates
6. Evaluate your blog post performance
You can use Excel to see how well your blog posts are doing. The most basic version of this involves noting down how many comments each blog post received. If you have a sharing plugin with share counters, you can also make a note of how many times the post has been shared on each social media network.
Pair this with Google Analytics insights and you can even see which one of your blog posts lead potential visitors to sign up for your email list or book your services.
Related: How to use your blog as a lead magnet to understand customers
7. Keep an eye on your site traffic
Lastly, don't forget that you can use Excel to create a quick snapshot of your site traffic. All you have to do is enter how many visitors your website receives each month. You can easily do this by importing a report from Google Analytics.
Try to get more specific by noting down which keywords visitors are using to find your site and how long they spend on it. You can also log your bounce rate and then use that information to improve your site and your marketing campaigns.
Related: How to set up Google Analytics funnels
Final thoughts
Keeping track of your key performance indicators is a good way to stay on top of how your business is currently doing and assessing how close you are to meeting your business goals. Luckily, you can easily keep track of your business KPIs with Excel. Start by implementing the tips in this article and take advantage of everything Excel has to offer.